
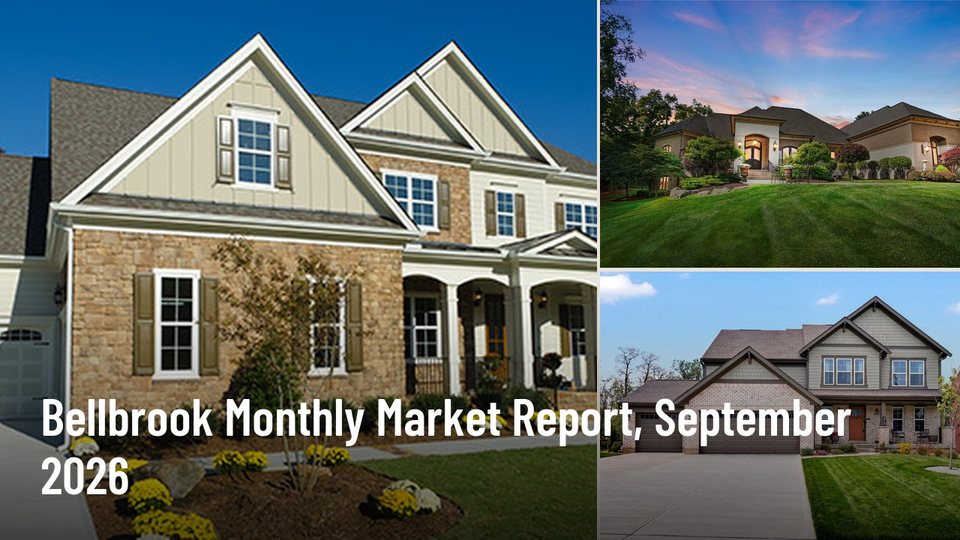
September brought 16 closed homes and condominiums in the Bellbrook search area covered by this site. The median sale price was $557,495, compared with $500,000 in August 2026. These are completed sales for September 1–30, 2026.
This report follows Sugarcreek school district; residential homes and condominiums. Its geography matches the main-area search, rather than assuming that a school district or township stops at a municipal boundary. Land, farms and multifamily investment listings are excluded. Sources and coverage.
September closings at a glance
Compared with August 2026.
| Metric | September 2026 | August 2026 |
|---|---|---|
| Closed homes and condos | 16 | 19 |
| Median sale price | $557,495 | $500,000 |
| Average sale price | $614,243 | $536,110 |
| Reported sales volume | $9,827,890 | $10,186,087 |
| Median reported days on market | 26.5 days | 21 days |
| Median sale price per square foot | $177 | $173 |
| Average sale-to-listed asking ratio | 97.9% | 98.1% |
Closing volume was 15.8% lower than August 2026: 16 closings versus 19. The median for this month's closed-home mix was 11.5% higher than the previous month's median. Different sizes, locations, conditions and property types can move a monthly median; that difference does not measure appreciation of an individual home.
YOUR MIAMI VALLEY REALTORS
Talk with Don & Cyndi
Have a question about a home, a neighborhood or your next move? We’ll help you work through the details with local guidance.
Reading the closed-sale mix
The month's sale prices ranged from $245,000 to $2,100,000. The median reported time on market was 26.5 days. A median describes the middle observation, while the average can move with a handful of expensive or lower-priced closings.
For a seller, the useful comparison is a group of homes with a similar location, floor plan, size and condition. For a buyer, these closings show completed outcomes; current competition and the details of the home you are considering still matter. Don and Cyndi can help you compare those properties before making a pricing or offer decision.
Examples from the month
These properties illustrate the range of this month’s completed sales.
6651 Possum Run Road, Sugarcreek Twp
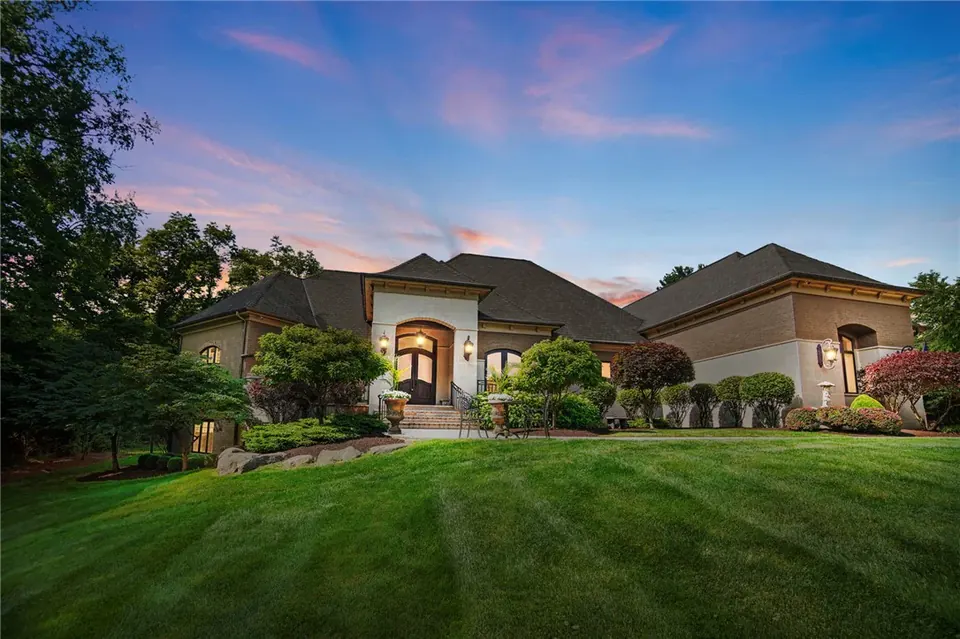
This Sugarcreek Twp property closed at $2,100,000 against a listed asking price of $2,450,000. The record reports 6,602 square feet of living area. This is a completed sale. Read the property record.
1593 Bur Oak Drive, Bellbrook
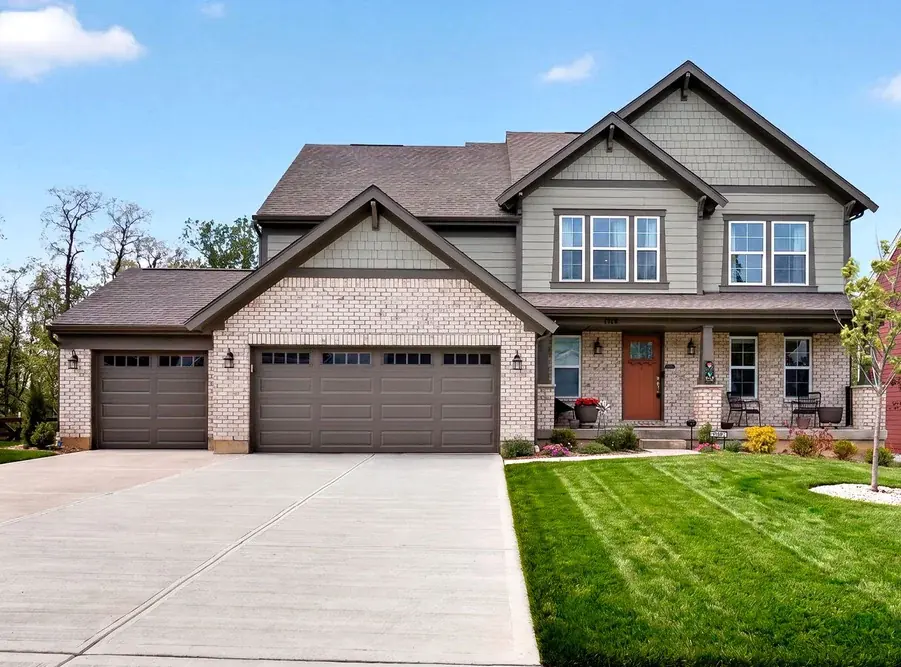
This Bellbrook property closed at $600,000 against a listed asking price of $619,000. The record reports 3,349 square feet of living area. This is a completed sale. Read the property record.
2542 Valais Court, Sugarcreek Twp
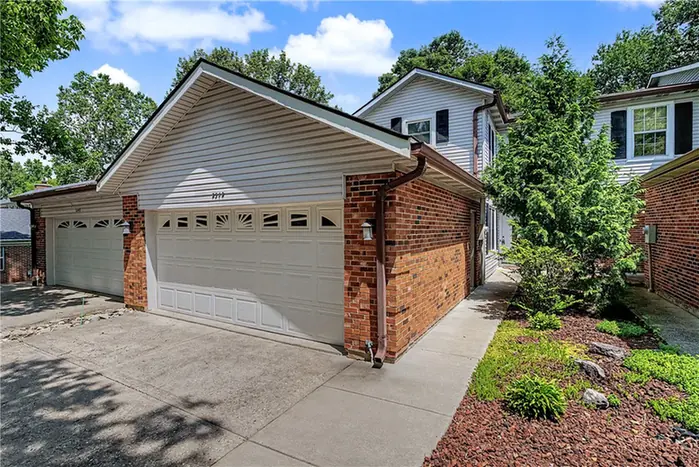
This Sugarcreek Twp property closed at $245,000 against a listed asking price of $255,000. The record reports 2,125 square feet of living area. This is a completed sale. Read the property record.
The wider Dayton market
Dayton REALTORS® recorded 1,261 September regional sales and a $271,500 median. Regional monthly figures.
The regional figures cover a broader MLS area. The local table uses this report’s stated main-area search scope.
Questions about this report
What area does this Bellbrook report cover?
Sugarcreek school district; residential homes and condominiums. The report includes residential homes and condominiums with an explicit closing date during the reporting month.
Does the $557,495 median tell me what my home is worth?
The median describes this month's completed-sale mix. Your home's location, size, condition, improvements and comparable properties still need an individual review.
Does this report show how many homes were available at month end?
This report focuses on completed sales. It does not project today's active or pending homes back into the past month. Use the main-area search for current availability.
What does the sale-to-listed asking ratio compare?
It compares each closed sale price with the listed asking price in that property record, then averages the valid ratios. It does not reconstruct the property's original asking-price history.
Sources and coverage
The local calculations use the complete native MLS closed-record query for this main area, collected October 13, 2026. Closing dates are retained as calendar dates. Only homes and condominiums with an explicit closing date in the reporting month are included. Reported days on market is the MLS listing-data field, distinct from the full listing-to-closing duration.
Source links: native MLS closed listing data; Dayton REALTORS® monthly regional release. Sale-price-per-square-foot uses only records with a positive stated living area. Asking-price ratios use only positive listed asking prices.
See all 16 closed property records used for this month
| Property record | Closing date | Sale price |
|---|---|---|
| 1643 Honey Tree Pl, Sugarcreek Twp · MLS 963678 | 2026-09-01 | $259,000 |
| 1872 Sugar Run Trail, Bellbrook · MLS 964591 | 2026-09-01 | $442,000 |
| 3243 Spillway Court, Bellbrook · MLS 961818 | 2026-09-03 | $400,000 |
| 3953 Jacob Hills Court, Bellbrook · MLS 956427 | 2026-09-04 | $699,000 |
| 6651 Possum Run Road, Sugarcreek Twp · MLS 960736 | 2026-09-08 | $2,100,000 |
| 3896 Northfield Dr., Bellbrook · MLS 963470 | 2026-09-10 | $600,000 |
| 1262 Park Terrace, Sugarcreek Twp · MLS 966236 | 2026-09-15 | $372,500 |
| 2542 Valais Court, Sugarcreek Twp · MLS 964397 | 2026-09-17 | $245,000 |
| 4401 Hillcrest Drive, Bellbrook · MLS 966434 | 2026-09-17 | $250,000 |
| 1593 Bur Oak Drive, Bellbrook · MLS 957690 | 2026-09-22 | $600,000 |
| 3859 Callaway Court, Bellbrook · MLS 962449 | 2026-09-23 | $514,990 |
| 2054 Winding Brook Way, Xenia · MLS 965307 | 2026-09-25 | $790,000 |
| 2415 Tennyson Drive, Bellbrook · MLS 952725 | 2026-09-28 | $340,000 |
| 1529 Clear Brook Drive, Sugarcreek Twp · MLS 963239 | 2026-09-29 | $610,400 |
| 2471 Lower Bellbrook Road, Sugarcreek Twp · MLS 950221 | 2026-09-30 | $810,000 |
| 2535 S Creek Circle, Spring Valley Twp · MLS 967277 | 2026-09-30 | $795,000 |
More about Bellbrook
Explore the Bellbrook area guide and current homes, or read all Bellbrook blog articles.
YOUR MIAMI VALLEY REALTORS
Talk with Don & Cyndi
Have a question about a home, a neighborhood or your next move? We’ll help you work through the details with local guidance.